Back in May of 2021, we examined a few of SQL Server's Important SQL Server Functions. Now, it's time to turn our attention to MySQL to see what it offers us in terms of math and numeric functions. To see how they work in practice, we'll use them in queries that we'll run in Navicat 16 for MySQL.
One of the key ingredients to writing effective SQL queries is the ability to articulate a wide variety of conditions using SQL syntax. One condition that gives both newbies and experienced database developers pause for thought is the Exclusive OR. Software programmers tend to be more familiar with the syntax for the Exclusive OR condition, probably because most programming languages support the XOR logical operator, whereas many databases do not.
In simple terms, the Exclusive OR condition is similar to the regular OR, except that, in the case of the Exclusive OR, only one of the compared operands may be true, and not both. In this blog, we'll learn how to express an Exclusive OR condition for a variety of databases, whether they support the XOR operator, or not.
Recently, we learned how to generate test data using Navicat 16's new Data Generation tool. It can help produce a large volume of complex testing data over multiple related tables, all guided by a multi-step wizard. In today's follow-up, we'll go through the process of creating a MySQL test database - all using Navicat 16.
As mentioned in the recent Present Your Data More Effectively with Navicat 16 blog, Navicat 16 added some new charting features, such as support for more data sources and chart types as well as an increased focus on usability and accessibility. These improvements coincide with the release of the new standalone Navicat Charts Creator. This blog will provide a tour of the Navicat Charts Creator and demonstrate how the Navicat Charts Creator can help you to gain deeper insights from your data.
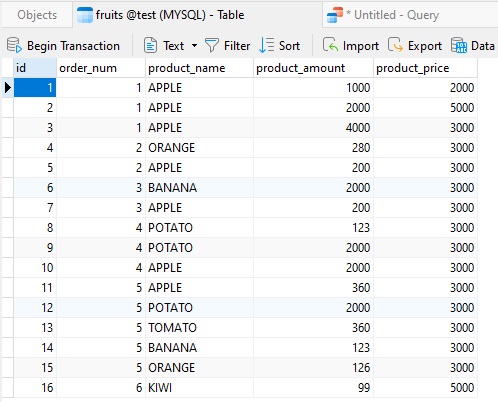
There are many times where you'll want to see the relative contribution of a row (or group of rows) to the total row count. In other words, what percentage of the total count a row represents. To illustrate, let's take the following table, shown in Navicat Premium 16:

- 2024 (1)
- 2023 (1)
- 2022 (1)
- 2021 (1)
- 2020 (1)
- 2019 (1)
- 2018 (1)
- 2017 (1)


