

In the realm of database optimization, understanding and monitoring query execution time is crucial. Whether you're a database administrator, developer, or involved in performance tuning, knowing how to measure the time a query takes to execute can provide valuable insights into the efficiency of your database operations. In this article, we'll explore various techniques for measuring query execution time in popular relational databases such as MySQL, PostgreSQL, and Microsoft SQL Server.
MySQL
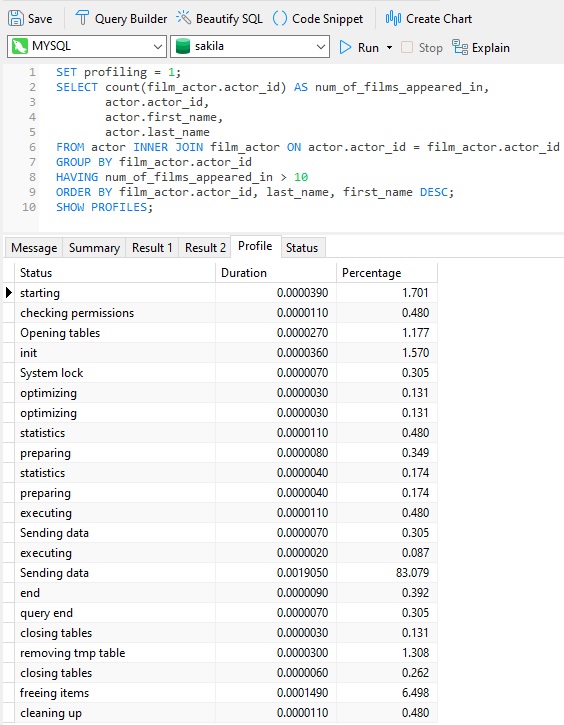
Using SQL Profiler:
SET profiling = 1;
-- Your SQL Query Goes Here
SHOW PROFILES;
This sequence of commands enables profiling, executes your query, and then shows the profiling results. Look for the "Duration" column to find the execution time in seconds.
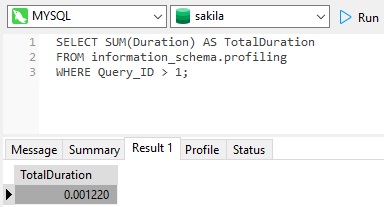
To calculate the total duration, you can use the following SQL query:
SELECT SUM(Duration) AS TotalDuration
FROM information_schema.profiling
WHERE Query_ID > 1;
PostgreSQL
Enabling Timing:
PostgreSQL has a built-in feature to measure query execution time. You can enable timing by executing the following command:
\timing
-- Your SQL Query Goes Here
This will display the time taken to execute your query in milliseconds.
Using pg_stat_statements:
PostgreSQL comes with an extension called pg_stat_statements, which provides a detailed view of executed SQL statements. To use it, ensure the extension is enabled in your PostgreSQL configuration and execute the query:
SELECT total_time, calls, query
FROM pg_stat_statements
WHERE query = 'Your SQL Query Goes Here';
This will give you information about the total time spent executing the specified query.
Microsoft SQL Server
Using SET STATISTICS TIME:
SQL Server allows you to enable time statistics for a session using the SET STATISTICS TIME ON command. After executing your query, you'll receive a message in the "Messages" tab showing the total time:
SET STATISTICS TIME ON
-- Your SQL Query Goes Here
SET STATISTICS TIME OFF
Querying sys.dm_exec_query_stats:
For a more programmatic approach, you can query the sys.dm_exec_query_stats dynamic management view to get information about query execution times:
SELECT total_elapsed_time, execution_count, text
FROM sys.dm_exec_query_stats
CROSS APPLY sys.dm_exec_sql_text(sql_handle)
WHERE text LIKE 'Your SQL Query Goes Here%';
This query retrieves information about the total elapsed time and the number of times the query has been executed.
Oracle Database
Using SQL*Plus AUTOTRACE:
Oracle Database provides the SQL*Plus AUTOTRACE feature, which can be used to display execution plans and statistics for SQL statements. To enable it, use the following commands:
SET AUTOTRACE ON
-- Your SQL Query Goes Here
SET AUTOTRACE OFF
The output will include information about the elapsed time, CPU time, and other statistics.
Querying V$SQL:
For more detailed information, you can query the V$SQL dynamic performance view:
SELECT elapsed_time, executions, sql_text
FROM V$SQL
WHERE sql_text LIKE 'Your SQL Query Goes Here%';
This query retrieves information about the elapsed time and the number of executions for the specified query.
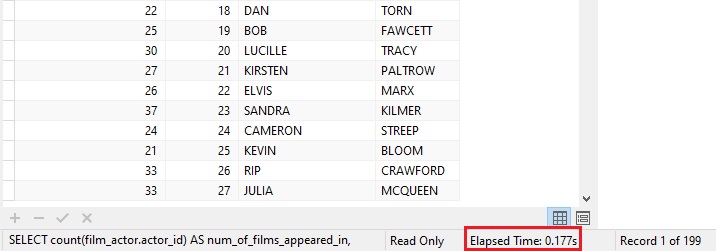
Viewing Execution Time in Navicat
If you only need to view the total execution time of a query, you can find it at the bottom of the main Navicat application window, along with other pertinent query details:
Conclusion
Understanding and optimizing query execution time is fundamental to maintaining a high-performing database. By leveraging the tools and techniques discussed in this article, you can gain valuable insights into your database's performance and take proactive steps to enhance efficiency. Whether you're working with MySQL, PostgreSQL, Microsoft SQL Server, or Oracle Database, measuring and analyzing query execution time is a worthwhile endeavor for any database professional.