Navicat Monitor for MySQL/MariaDB's starting screen is the Overview Dashboard. It's a one-stop shop of the real-time analytics for the health and performance of all your instances. Since the introduction of Compact View in version 1.7, you can now monitor hundreds of instances at a glance! In today's blog, we'll learn how to build a customized dashboard for your server metrics to get a global view of each instance, as well as apply instance grouping.
One Screen, Two Views
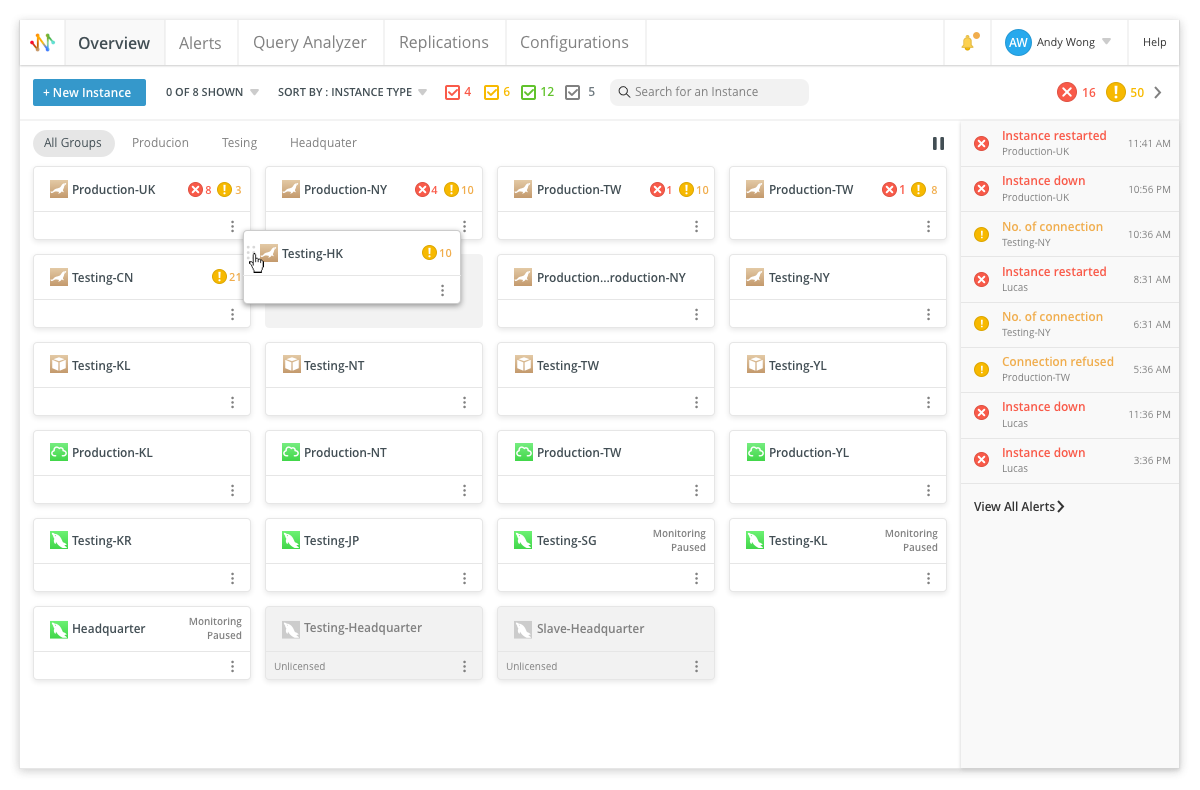
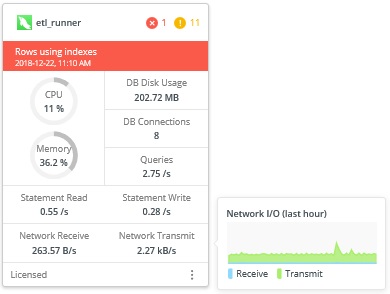
The Overview Dashboard can present instance information in one of two ways: Comfort View and the new Compact View that was introduced in version 1.7. Comfort View employs instance cards to let you identify the server status and system resource usage, while the latter presents a more streamlined set of data cards about each instance. Here's a comparison of each:
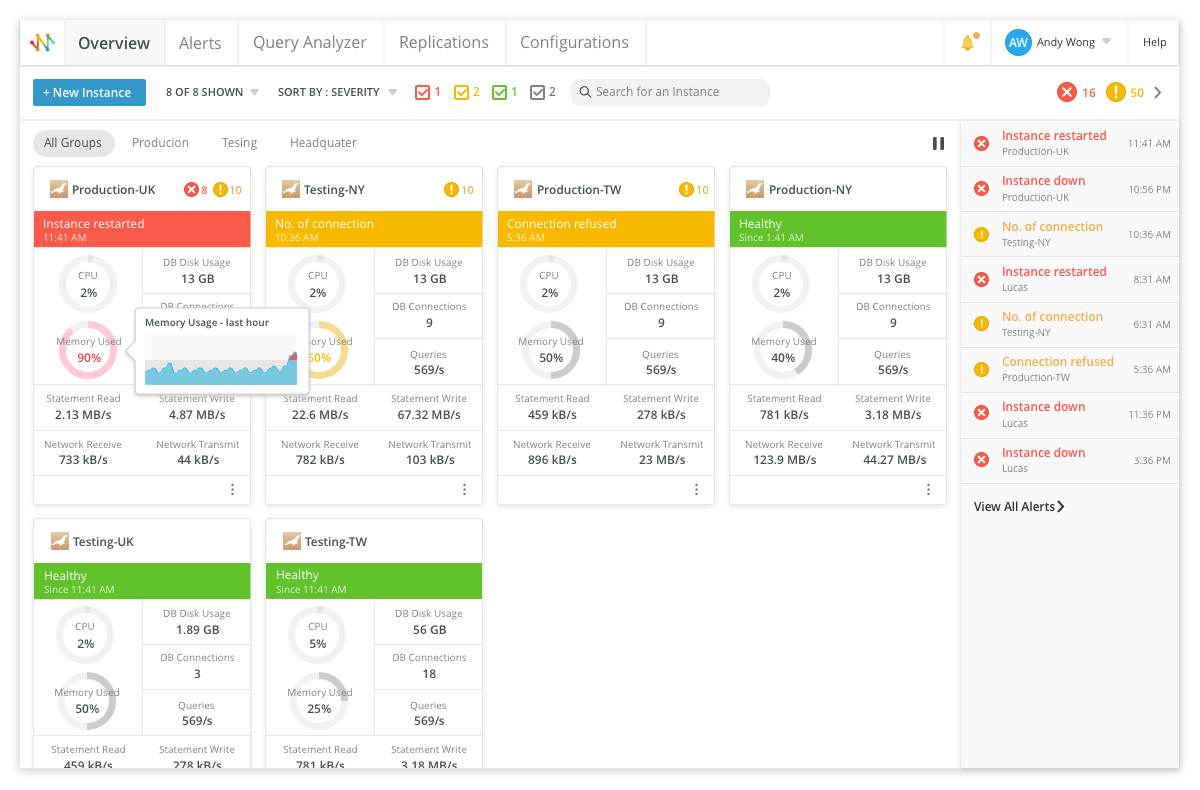
Assessing Server Status
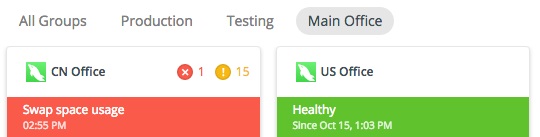
Compact View shows the instance name, along with the number of Critical and Warning issues. For more information, choose Comfort View. Each card in Comfort View shows a bright green, orange, red, or gray Status Bar indicating the status of your instances at a glance. These colors correspond to Healthy, Warnings, Critical, and Paused. This allows you to easily identify instances which require immediate attention. You can click on the Status Bar to see a list of all warnings and/or alerts for that instance.
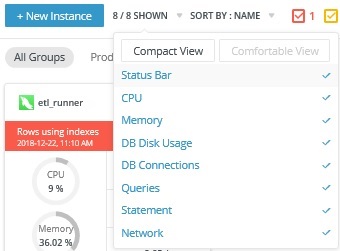
Customizing Card Metrics
By default, instance cards show all available system resource usages. Click the "X / Y Shown" label and uncheck the metrics that you are not interested in. You can also use it to change the display style that works best for you by choosing Compact View or Comfortable View:
Getting More Information about a Metric
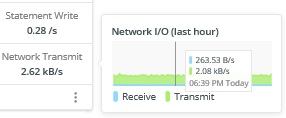
Hovering the mouse pointer over a metric in a card brings up a small popup chart:
Moreover, hovering the mouse pointer over on the chart shows the time and the values at that point in time.
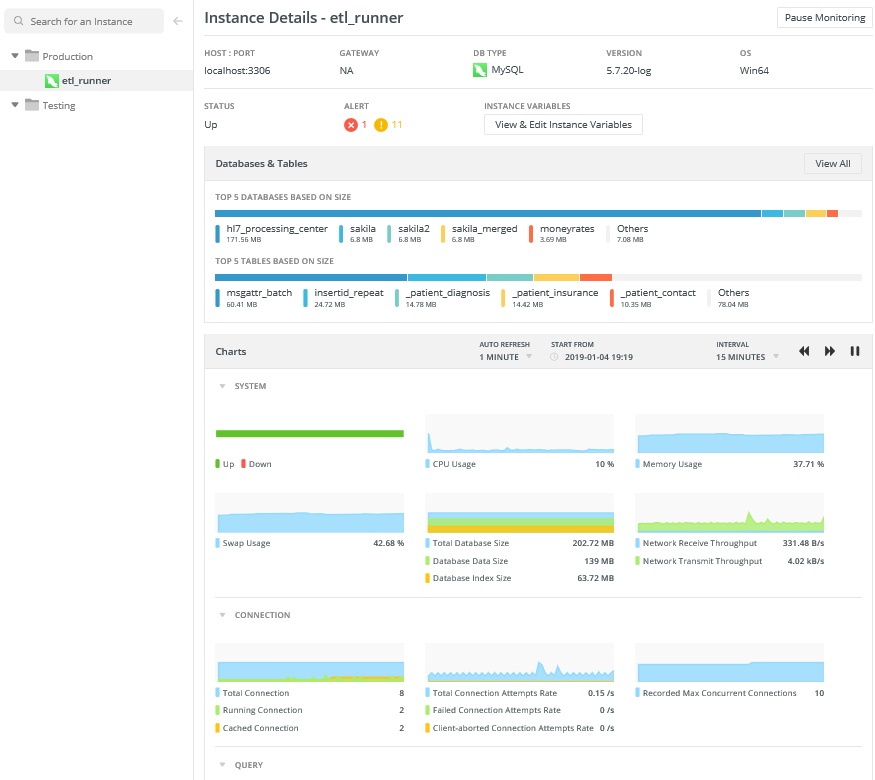
You can click anywhere on an instance to view its details and metrics:
Changing the Order of Instances
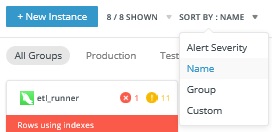
Want to change the order of your instances? Just click "SORT BY" and select a sorting option. If you choose "Alert Severity", the instance cards will be sorted by the severity level from critical to low. Selecting "Custom" allows you to position instances however you wish. To do that, click and hold the connection icon on an instance card and then drag-and-drop it to the desired position. Navicat Monitor automatically remembers your custom order!
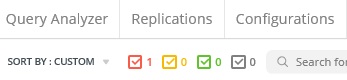
Filtering Instances
There are a couple of ways to filter instances. One way is to click an availability group name label above the instances:
You can also filter instances by their health states. At the top of the screen, there are four colored checkboxes with labels that show the total number of servers having critical alerts (red), warnings (orange), that are healthy (green), and that have paused or stopped monitoring (grey). Depending on its state, clicking a checkbox will either add or remove the instances by states in the selected group.