

With all of the excitement surrounding the release of Navicat 16, other noteworthy developments have been overshadowed somewhat. Perhaps none more so that the new standalone Navicat Charts Creator. Charting has been a part of Navicat products for some time now. Navicat 15 went even further to include data visualization in order to help identify trends, patterns and outliers. Navicat 16 adds even more features, by supporting more data sources and chart types as well as a focus on usability and accessibility. Suffice to say, Navicat can deliver information and present your findings in dashboard for sharing to a wider audience than ever before. In today's blog, we'll take a quick tour of Navicat 16's new charting tools.
Data Connectors
In order to create visualizations of your data, you first need to connect to a data source. Navicat Charts Creator allows you to quickly and securely connect to any data source of your choice via four built-in data connectors. These include:
 Relational DB:
For working with relational databases such as MySQL, MariaDB, PostgreSQL, Oracle, SQLite and SQL Server.
Relational DB:
For working with relational databases such as MySQL, MariaDB, PostgreSQL, Oracle, SQLite and SQL Server. File Types: Allows you to import data from external files such as Excel, Access, or CSV, from data stored on your computer, network, or accessible via an URL.
 ODBC:
For importing data from any ODBC data source including Sybase, Snowflake and DB2.
ODBC:
For importing data from any ODBC data source including Sybase, Snowflake and DB2. Linked File:
Lets you link your chart to data in data sources to update the chart according to changes in the underlying data.
Linked File:
Lets you link your chart to data in data sources to update the chart according to changes in the underlying data.
Chart Types
It's vitally important to choose the right type of chart so that your presentations convey the message you want to communicate. To that end, Navicat 16 includes a wide array of chart types, ranging from standard to exotic:
- Bar Chart
- Line / Area Chart
- Bar / Line Chart
- Pie Chart
- Heatmap / Treemap
- Pivot Table
- Scatter Chart
- Value
- Control
- KPI
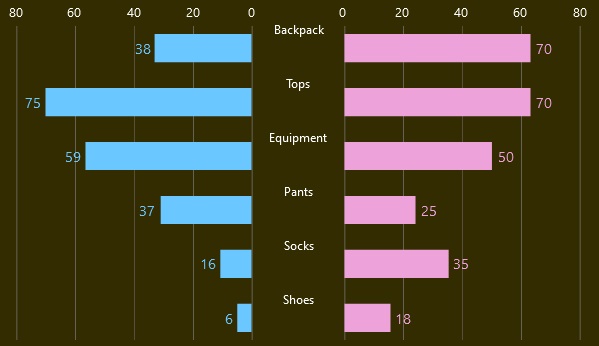
Navicat 16 also introduces the Waterfall, Tornado, and Gauge chart types.
Dashboards
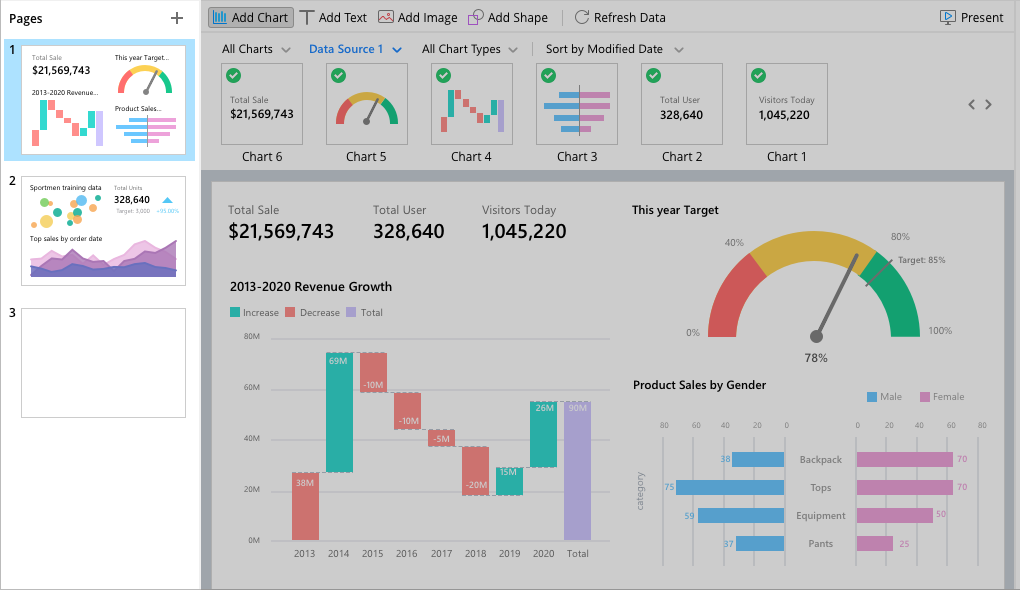
Dashboards combine a collection of widgets to give you an overview of the reports and metrics you care about most. As such, they provide a way to monitor many metrics at once, so you can quickly see correlations between different reports. In Navicat 16, a dashboard shows various topics that you would like to track in one place by displaying a collection of charts in an interactive way. These may be synchronized in order to better demonstrate how the charts are related. For example, hovering over one chart shows the effect in the other charts:
Each dashboard receives a thumbnail that gives you a visual hint of the types of charts you have, so you can more easily navigate between dashboards:
Conclusion
This blog provided a quick tour of Navicat 16's new charting tools. These are available in all Navicat database development tools as well as in the brand new standalone Charts Creator.
If you'd like to give Navicat 16 a try, you can download a 14-day fully functional FREE trial of Navicat here.


