

Database optimization is a rather large and sprawling topic that encompasses a multitude of strategies for reducing database system response times. These are often tailored to the specific usage patterns of a database instance or cluster. For instance, in some cases, lightning fast queries might be a goal, whereas for some organizations, faster write times may be what's desired most.
Improving query response times may include activities such as:
- careful construction of queries
- use of indexes
- using analysis tools such as EXPLAIN
In today's blog, we'll learn more about this vital topic in database administration.
Optimization Activities Described
As mentioned in the introduction, database optimization involves a number of strategies whose aim is to reduce database system response times. To that end, administrators (DBAs), developers and analysts may seek to decrease write times by working to improve the servers' data access methods and retrieval times through design techniques, statistical analysis and monitoring of system traffic. In this role, DBAs/analysts need to possess a strong knowledge of the structure of the data, the applications installed on the server and the impact varied tasks have on the database's overall performance.
Typically, database tuning and optimization can require a high degree of expertise, an understanding of execution plans, as well as the ability to write high-performing SQL. It also tends to be a highly time-consuming endeavor, because there can be a huge number of SQL statements to fine tune. Once you've determined which statements need tuning, you then need to refine your tuning approach to suit each and every query, as there is no one-size-fits-all solution.
Tools of the Trade
Query optimization is usually the best place to focus your efforts for two reasons: it's the easiest part of the optimization equation and tends to result in the most bang for your buck in terms of reward versus effort. Part of the reason that query optimization is the lowest hanging fruit is that there are a number of tools that you can use to aid you in your quest for improved database performance. Here are a few:
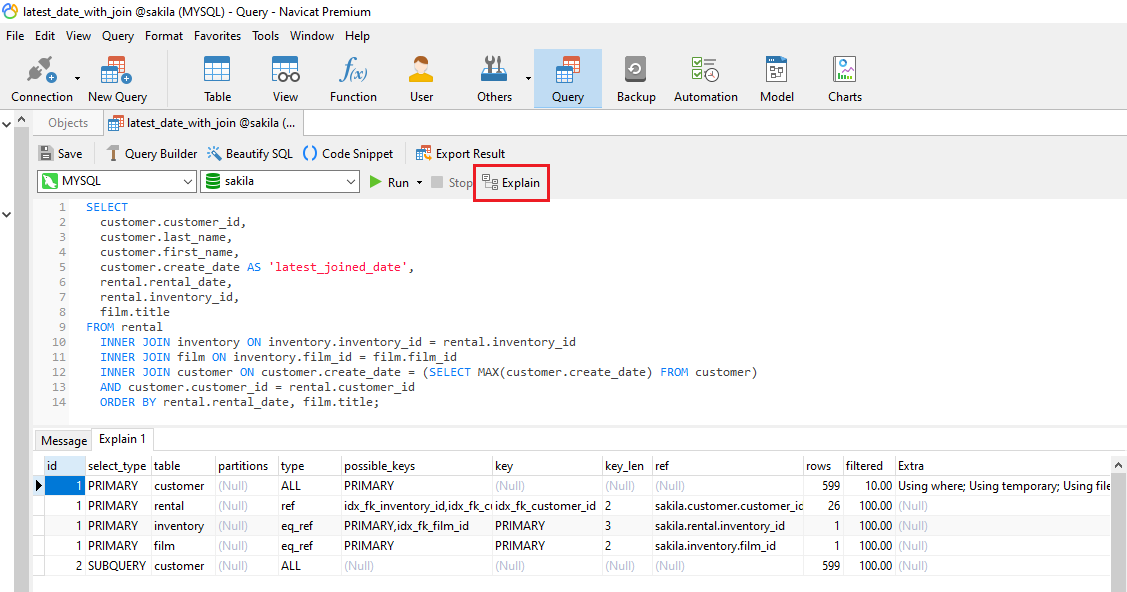
Using EXPLAIN
If you've got one query that runs consistently slow, then it probably needs to be optimized further. A good way to see what it needs is to use the EXPLAIN command. It returns a formatted description of the query optimizer's execution plan for the specified statement. You can use this information to analyze and troubleshoot the query.
By default, EXPLAIN output represents the query plan as a hierarchy whereby each level represents a single database operation that the optimizer defines to execute the query. In Navicat database clients, there's a button in the SQL Editor that runs EXPLAIN. Results are displayed in an easy-to-read grid format:
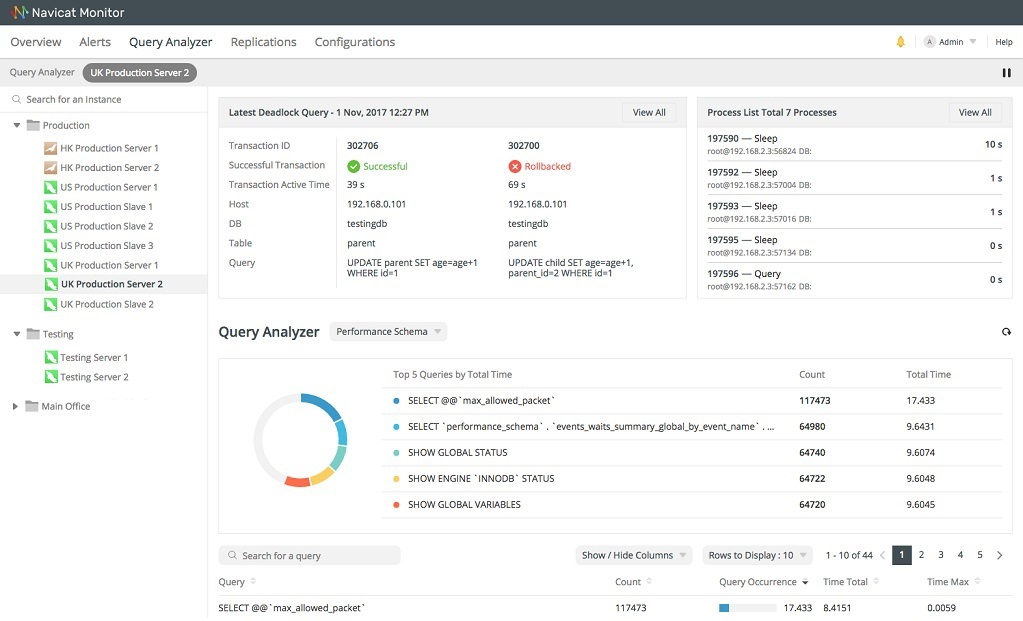
Analyzing Query Performance using a Monitoring Tool
You can also analyze your query performance using a tool like Navicat Monitor. It has a Query Analyzer that shows information of all executing queries. Moreover, it can help identify slow queries and detect deadlocks, i.e. when two or more queries permanently block each other.
Conclusion
Finally, if your DBMS supports query profiling, you can use it to measure query execution time. While perhaps not quite as powerful as the tools we saw here today, it might be worth a try.


